Bitcoin's Relief Rally Stalls: On-Chain Signals Flash Warning Signs
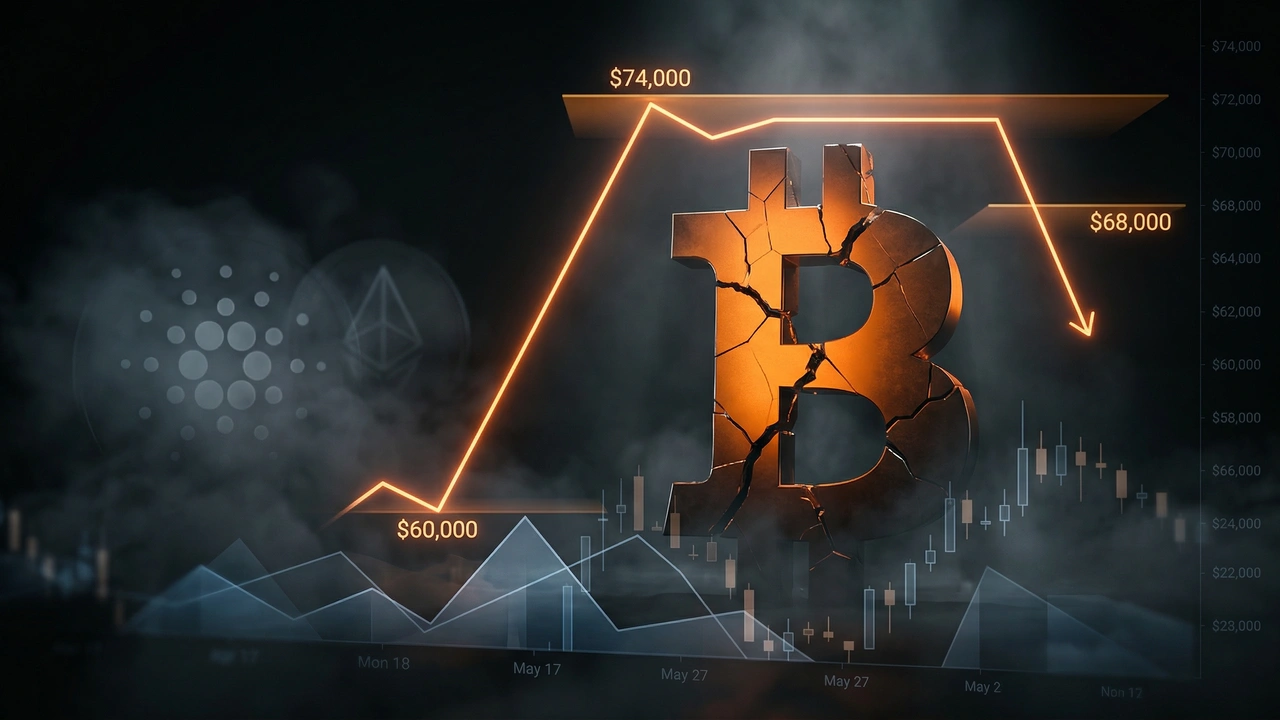
Bitcoin's rebound from $60,000 has hit a wall at $74,000, while altcoin on-chain data reveals structural weaknesses beneath the surface recovery — raising serious questions about whether this cycle's bottom is truly in.
Wichtigste Erkenntnisse
- Bitcoin's bounce to $74,000 was rejected at the prior breakdown level, and the $68,000–$70,000 support zone is now the critical battleground — a confirmed close below it likely targets $60,000 [2]
- On-chain data from CryptoQuant's Bull Score Index remains firmly in bearish territory, suggesting the current rally is a relief bounce rather than the start of a new bull cycle [2]
- Cardano's 10% recovery was driven primarily by leveraged derivatives activity rather than spot demand, making it structurally fragile and vulnerable to rapid reversal [1]
- A sharp 54% spike in ADA's Spent Coins Age Band metric — combined with 210 million ADA in whale selling worth ~$56.7M — signals that sophisticated long-term holders used the rally as a distribution event, not an accumulation opportunity [1]
- The BTC-to-gold ratio's 13-month decline toward historical bottom territory is one of the few constructive longer-term signals, but macro bottoming processes are rarely clean or fast — patience and risk discipline remain essential [2]
The Crypto Market's Bounce Is Paper-Thin — And the Data Proves It
The cryptocurrency market staged what looked like a convincing recovery over the past week, with Bitcoin clawing back toward $74,000 and altcoins posting double-digit gains. But peel back the price action and a troubling picture emerges: the rally appears to be built on leveraged speculation rather than genuine spot demand, while sophisticated investors — from large ADA whale wallets to macro-focused Bitcoin analysts — are quietly questioning whether this bounce has any real legs. The divergence between price performance and underlying market structure is stark, and investors would do well to pay close attention.
This is not simply a story about one coin or one chart pattern. It is a broader narrative about the fragility of crypto market recoveries in the absence of fundamental demand, and what that means for Bitcoin's trajectory heading into the months ahead.
The Facts
Bitcoin's relief rally ran into a hard ceiling at $74,000, a level that corresponds to a prior breakdown zone, and was subsequently rejected with force. Bears dragged the price back below $68,500, and analysts now identify the $68,000–$70,000 range — anchored by the 20-day exponential moving average at approximately $69,003 — as the pivotal support zone that will determine whether the recent bounce was a genuine reversal or a dead-cat bounce [2]. A sustained close below that band, according to multiple technical frameworks, reopens the path toward a retest of the $60,000 level [2].
The macro picture offers mixed signals. Coinbureau CEO Nic pointed out on X that Bitcoin's price relative to gold has historically required roughly 14 months to move from peak to trough, and that each bottom in this ratio has subsequently been followed by a Bitcoin rally exceeding 300% [2]. With the current decline from the previous ratio peak now stretching 13 months, this framework suggests BTC may be approaching a cyclical bottom. However, on-chain analytics firm CryptoQuant offered a sharply contrasting view, stating that its Bull Score Index remains "deep in bearish territory" and that the current rally is "likely just a relief rally, not the start of a new bull phase" [2].
The altcoin market reinforces this cautious reading. Cardano's ADA posted a roughly 10% gain during the broader recovery window, but on-chain data tells a more complicated story [1]. Order flow analysis indicates that the bulk of ADA's price movement was driven by the derivatives market — leveraged traders piling into long positions — rather than genuine spot buying [1]. This is a structurally weak foundation for any sustained advance. Making matters worse, the Spent Coins Age Band metric — which tracks the movement of older, dormant coins — spiked dramatically during the rally period, jumping from approximately 93 million ADA on March 3 to over 143 million ADA just two days later, a 54% surge in activity from long-term holders who may have seized the bounce to exit positions [1].
Whale behavior compounds the bearish undercurrent. Large ADA holders offloaded approximately 210 million ADA — equivalent to around $56.7 million — in a single week, a scale of distribution that places meaningful selling pressure on the market and signals that the biggest players are not buyers at current levels [1]. Across the broader altcoin complex, major assets including Ethereum, Solana, XRP, BNB, and Dogecoin all experienced similar patterns: brief breaks above key resistance levels followed by swift rejections, with bears firmly defending overhead supply zones [2].
Analysis & Context
What we are witnessing is a textbook example of a derivatives-fueled relief rally in a structurally weakened market — a pattern that Bitcoin and the broader crypto complex have revisited multiple times throughout their history. In the 2022 bear market, similar sequences played out repeatedly: sharp 20–30% bounces off local lows attracted leveraged speculation, temporarily pushing prices toward key resistance levels, before institutional and whale-level distribution reasserted downward pressure. The anatomy of the current move — futures-driven momentum, declining spot volumes, long-term holder distribution, and whale selling — maps uncomfortably closely onto those prior episodes.
The CryptoQuant Bull Score Index reading deserves particular weight here. That metric aggregates multiple on-chain signals including miner behavior, exchange flows, and holder cohort activity. When it reads deep in bearish territory during a price bounce, historical precedent strongly suggests the bounce is corrective rather than impulsive — meaning the dominant trend remains down until proven otherwise. The $74,000 rejection is consistent with this framework: it is precisely the kind of level where overhead supply from investors who bought during the prior bull phase sits heaviest, and where bears find their easiest selling opportunities.
For Bitcoin specifically, the BTC-to-gold ratio argument is one of the more compelling longer-term constructive signals available. If the 14-month cycle-to-trough pattern holds, a major inflection point could be near. But "near" in macro terms can still mean weeks or months of further price weakness, and the $60,000 support level identified by multiple analysts represents a plausible destination before any durable recovery takes hold. The altcoin situation is arguably even more delicate — assets like ADA, SOL, and ETH remain significantly below their prior cycle peaks, and with whale distribution actively underway, the risk of further drawdowns is real and measurable rather than merely theoretical.
Quellen
KI-gestützter Inhalt
Dieser Artikel wurde mit KI-Unterstützung erstellt. Alle Fakten stammen aus verifizierten Nachrichtenquellen.