Bitcoin at $80K: Caution Dominates as Sentiment Cools
Despite recovering from April lows, Bitcoin faces mounting headwinds as futures traders stay defensive, ETF outflows hit multi-month highs, and on-chain data reveals a critical overhead supply zone near $87,000.
Key Takeaways
- Bitcoin's recovery from April lows near $65,000 has been real but structurally thin - buyer aggression in futures has dropped roughly 35% from peak levels, and funding rates have remained negative since March, signaling that bears still dominate derivatives markets [1].
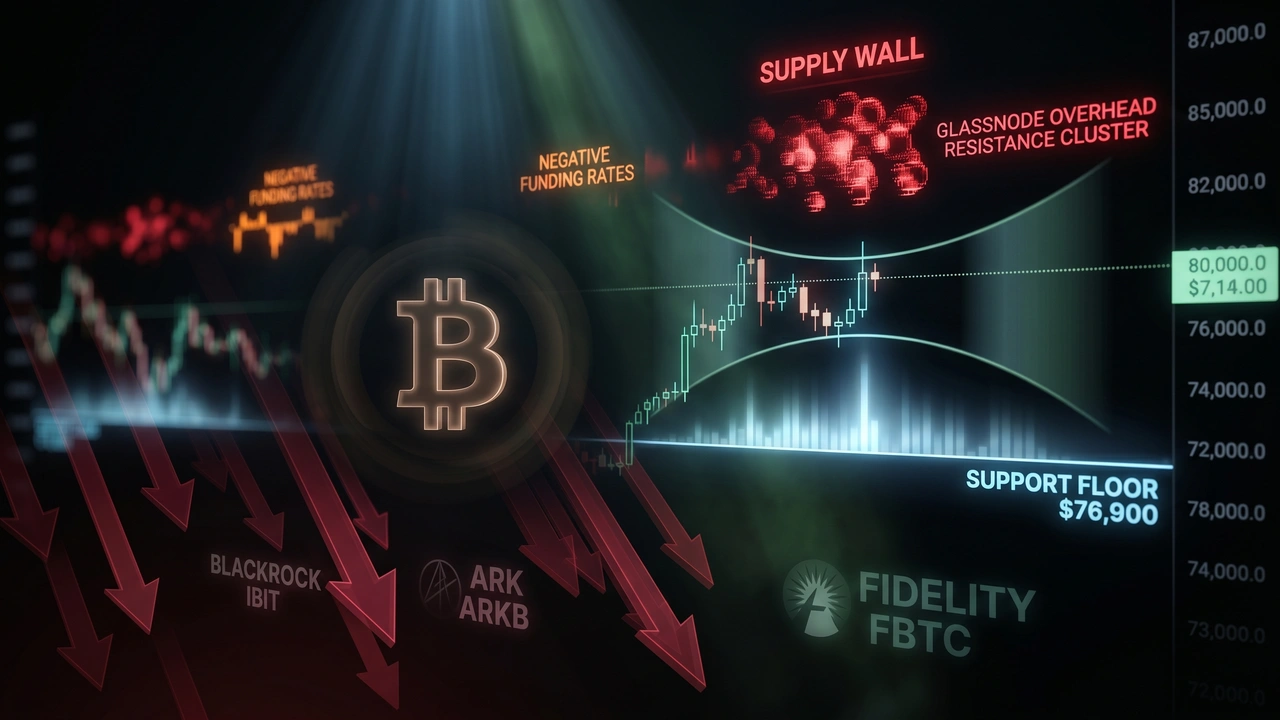
- A dense supply zone near $86,900, created by holders who accumulated between November and February and are now approaching breakeven, represents a significant overhead resistance level that could cap short-term upside [1].
- The largest single-day Bitcoin ETF outflows since late January - led by roughly $285 million leaving BlackRock's IBIT - suggest institutional sentiment is cautious and profit-taking pressure is real following a 37% rally [2].
- The Realized Cap Impulse metric remaining below zero is a key signal to watch: fresh capital has not returned to the market at levels consistent with previous breakout phases, and a move above zero would be the clearest early indicator of a genuine new bull leg [1].
- On-chain data points to potential support near $70,000 if the current consolidation breaks lower, making that level the critical downside reference point for risk assessment in the near term [2].
Bitcoin Stalls at $80,000 While the Market Sends Mixed Signals
Bitcoin has clawed back significant ground from its April lows, staging a 37% recovery that briefly recaptured the psychologically important $80,000 level. But beneath the surface, the data tells a more cautious story. Futures traders are not adding bullish positions, fresh capital inflows remain below breakout thresholds, and spot ETFs just recorded their largest single-day outflows since late January. The question is no longer whether Bitcoin can bounce - it clearly can. The question is whether this recovery has the structural support to become something more.
The gap between price action and market conviction is growing harder to ignore. When rallies are built on thin participation and defensive positioning, they tend to exhaust quickly. That is exactly the pattern emerging right now, and understanding it is critical for anyone trying to read where Bitcoin heads next.
The Facts
On-chain analytics firm Glassnode has identified a significant cluster of Bitcoin holders concentrated around the $86,900 price level [1]. These investors accumulated their coins between November and February and are now approaching their breakeven point after extended drawdowns. The concern is straightforward: holders who have endured months of losses often sell when they get back to even, creating a dense supply wall that can stall or reverse upward momentum.
At the same time, short-term buyers appear to be supporting the market around $76,900, which represents the average cost basis for coins purchased over the past 30 days [1]. This suggests fresh demand is still entering the market at lower levels, providing a floor of sorts - but that floor sits well below the resistance ceiling near $87,000, leaving Bitcoin navigating a compressed range.
Futures market data reinforces the cautious tone. Bitcoin researcher Axel Adler Jr. noted that the 30-day net taker volume indicator climbed to +2.0 on May 6 before pulling back to +1.25 by mid-week - a roughly 35% decline in buyer aggression within days [1]. Meanwhile, the 30-day Bitcoin funding rate has remained negative since March, meaning short traders are actually paying long traders to maintain their positions [1]. Negative funding is a direct expression of bearish dominance in the derivatives market, and that signal has persisted even as spot prices recovered above $80,000.
Alphractal CEO Joao Wedson pointed to the Realized Cap Impulse metric as another warning sign [1]. This indicator, which tracks whether net new capital is entering or leaving the Bitcoin ecosystem, remains slightly below zero. Wedson stated that a move back above zero would be the first credible signal that investors are genuinely committing fresh money to the market at scale - something that has not yet materialized.
On the ETF front, the picture deteriorated sharply. Spot Bitcoin ETFs recorded their largest single-day outflows since January 29, with BlackRock's IBIT alone seeing approximately $285 million exit the fund [2]. ARK 21Shares' ARKB and Fidelity's FBTC added $177 million and $133.2 million in outflows respectively [2]. CryptoQuant analysts flagged rising profit-taking, elevated unrealized gains, and weakening US spot demand as signs that the rally's momentum may be fading, and pointed to on-chain data suggesting potential support near $70,000 should a deeper correction develop [2].
Analysis & Context
What we are witnessing is a classic post-recovery tension that Bitcoin has navigated multiple times across its history. The 2019 recovery from the December 2018 lows followed a strikingly similar script: price rebounded sharply, derivatives traders remained skeptical, and overhead supply from investors near breakeven created a ceiling that took months to fully clear. The difference this cycle is the added dimension of institutional ETF flows, which can amplify both conviction and fear in ways the market had not seen before 2024.
The negative funding rate environment is particularly telling. In healthy bull markets, funding rates tend to stay positive or neutral as long traders pay a premium to hold their positions - a sign of genuine directional conviction. When funding stays negative through a significant price recovery, it signals that the rally is being driven primarily by spot buying rather than leveraged long positioning. That can actually be a healthier foundation in theory, but combined with the cooling Realized Cap Impulse metric and the ETF outflow data, it suggests institutional and sophisticated market participants are not yet ready to commit to the next leg higher.
The $82,400 level - coinciding with the 200-day moving average - is the technical line that matters most right now [2]. CryptoQuant has noted that this level has historically served as major resistance during bear-market rebounds, and Bitcoin has already bumped against it in this recovery. Whether the market can build enough conviction to flip that level into support will likely determine whether this is a genuine trend reversal or a prolonged range-bound consolidation. The supply concentration near $86,900 and the lack of aggressive long positioning in futures both argue for patience rather than premature optimism.
Sources
AI-Assisted Content
This article was created with AI assistance. All facts are sourced from verified news outlets.