Bitcoin at $82K: Recovery Rally or Bull Trap in Disguise?
Bitcoin briefly surpassed $82,000 for the first time since February, but seasoned analysts warn that the real test lies ahead - with the 200-day moving average and a critical $60,000 support level defining the boundaries of the current market cycle.
Key Takeaways
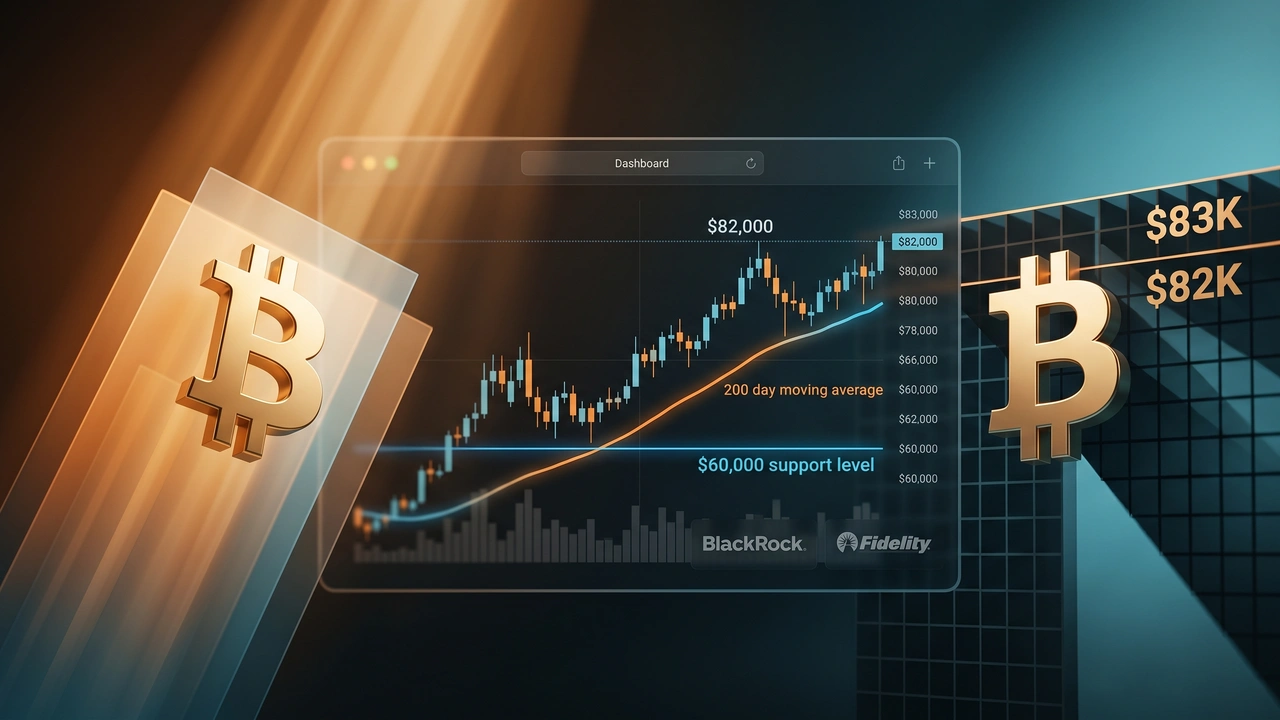
- Bitcoin's move above $82,000 is an encouraging development, but analyst James Check makes clear that the bull case is only fully confirmed by a new all-time high - and invalidated by a break below $60,000[1]
- The 200-day moving average near $83,000 represents the next critical resistance zone, with a surrounding supply cluster potentially extending that ceiling to $85,000[1]
- US spot ETF inflows surged to nearly $1 billion at the start of the week but dropped sharply to $46.2 million on Thursday, signaling that institutional demand remains inconsistent rather than structurally committed[2]
- Toncoin's 102% weekly surge highlights growing divergence within the crypto market - investors should assess whether this signals broad risk appetite returning or simply capital rotating away from Bitcoin into speculative alternatives[2]
- Check's advice to accumulate steadily through the lower ranges of the market cycle - rather than chasing perfect timing - reflects a disciplined approach that has historically served long-term Bitcoin holders better than reactive trading[1]
Bitcoin Breaks $82K, But the Hard Work Has Only Begun
After nearly two months of grinding consolidation between $65,000 and $75,000, Bitcoin finally showed signs of life - breaking above $82,000 for the first time since early February. The move has reignited bullish sentiment across the market, with ETF inflows surging, institutional players making headlines, and regulatory tailwinds gathering strength. Yet the most experienced voices in on-chain analysis are urging investors not to confuse a promising recovery with a confirmed bull market. The distance between a relief rally and a genuine trend reversal can be measured in patience - and in price levels.
This is the defining tension of the current Bitcoin market: the narrative and the data are telling slightly different stories, and the resolution of that conflict over the coming weeks could set the tone for the remainder of 2025.
The Facts
Bitcoin surged above $82,000 on Wednesday afternoon, marking its highest price since early February and generating renewed optimism among investors who had endured weeks of failed breakout attempts[1]. The move came alongside a meaningful rebound in US spot Bitcoin ETF inflows, with major issuers including BlackRock and Fidelity collectively gathering nearly $1 billion in fresh capital at the start of the week[2]. However, that momentum showed early signs of cooling - by Thursday, net inflows had dropped sharply to $46.2 million, suggesting that institutional appetite, while present, remains selective[2].
By Thursday morning, Bitcoin had pulled back slightly to consolidate around $81,500, a move analysts characterized as a natural pause following several days of upward momentum[2]. Ethereum mirrored this hesitation, trading near $2,340 with a modest 1.5% decline on the day[2]. The broader crypto market appeared to be catching its breath after an aggressive recovery phase.
Analyst James Check, widely known in the Bitcoin community as "Checkmate," offered a measured assessment of where things stand. He argued that genuine market bottoms require a meaningful transfer of coins from speculative buyers who purchased near cycle highs to conviction buyers who accumulate during downturns[1]. According to Check, the bullish case is only fully confirmed by a new all-time high - but it would be invalidated if Bitcoin breaks below the $60,000 level[1]. In the near term, he identified the 200-day moving average near $83,000 as the next meaningful resistance zone, with the surrounding supply cluster potentially extending that resistance up to $85,000[1].
While Bitcoin consolidated, a striking divergence emerged elsewhere in the market. Toncoin surged over 100% on a weekly basis, reaching $2.65 at the time of writing, as traders priced in Telegram's expanded role as the largest validator on The Open Network[2]. Telegram founder Pavel Durov publicly defended the move, arguing that Telegram's validator status would actually strengthen decentralization by providing a counterbalance that encourages broader participation in the validator pool[2]. On-chain analytics platform Santiment tracked a sixfold spike in social media mentions of Toncoin within a four-hour window on May 5th, underscoring how rapidly retail sentiment shifted toward the asset[2].
Analysis & Context
The current Bitcoin setup carries echoes of several historical consolidation phases - most notably the extended sideways action seen in late 2020 before the final leg of that bull cycle, and the more cautious recovery patterns observed in early 2019 following the brutal 2018 bear market. In both cases, the market experienced sharp, sentiment-driven rallies that tested major resistance levels before ultimately resolving in one direction. The key variable was always whether the fundamental demand structure beneath the price was genuine accumulation or speculative repositioning.
What makes Check's framework particularly useful here is its emphasis on coin movement rather than price momentum alone. A rally driven primarily by short-term traders and ETF arbitrageurs carries a very different risk profile than one supported by long-term holders quietly absorbing supply at lower levels. The ETF inflow data tells a nuanced story in this regard - the near-billion-dollar week was impressive, but the sharp single-day drop to $46 million on Thursday suggests that institutional demand is reactive rather than structural at this stage. Real conviction buying tends to be steadier and less sensitive to daily price fluctuations.
The Toncoin explosion is also worth examining as a broader market signal. Historically, sharp outperformance in altcoins during Bitcoin consolidation phases has cut both ways. Sometimes it signals that risk appetite is returning broadly across the crypto ecosystem, which eventually pulls Bitcoin higher. Other times, it reflects capital rotation away from Bitcoin into higher-beta assets, which can actually signal that the Bitcoin recovery lacks conviction. The sustainability of Toncoin's rally - built on a governance decision that the market is currently interpreting positively despite structural parallels to moves that triggered backlash elsewhere - will be worth watching closely in the days ahead. The crypto community's tolerance for centralization risk has proven to be highly variable, and sentiment shifts can reverse quickly when they are driven by narrative rather than fundamentals.
For Bitcoin specifically, the $83,000 to $85,000 resistance zone is the immediate test. A clean break above that range, supported by sustained ETF inflows and on-chain accumulation data, would significantly strengthen the bull case. A rejection and a slide back below $78,000 would raise serious questions about whether this recovery has the structural support it needs.
Sources
- [1]btc-echo.de
- [2]btc-echo.de
AI-Assisted Content
This article was created with AI assistance. All facts are sourced from verified news outlets.