Bitcoin's $1.4B Short Squeeze Setup: Bears Walk a Tightrope at $80K
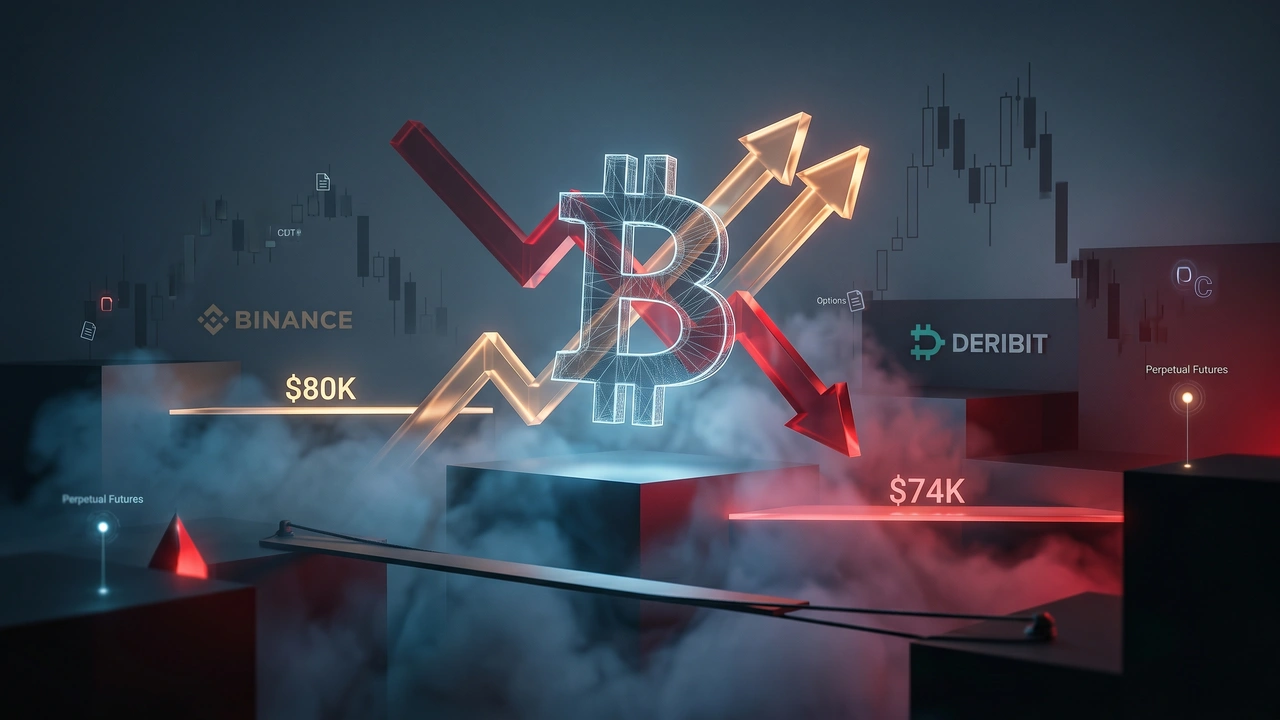
With $1.4 billion in short positions concentrated near $80,000 and funding rates at historic lows, Bitcoin's derivatives market is primed for a violent unwind — but conflicting technical signals warn of a potential dip to $74K first.
Key Takeaways
- The short squeeze risk is real and quantifiable: $1.4 billion in short positions concentrated near $80,000 means a sustained push through that level could trigger a cascade of forced liquidations, potentially accelerating price well beyond the initial breakout target [1].
- Negative funding rates at historic extremes are a contrarian signal: When shorts are paying record premiums to maintain bearish positions while price holds relatively firm, history suggests the crowded trade is the more dangerous one [2].
- Spot and on-chain fundamentals remain structurally bullish: ETF inflows, corporate accumulation, and long-term holder behavior all point to supply contraction that supports price over the medium term, regardless of short-term volatility [1][2].
- A dip to $73,700–$74,700 should not be confused with a trend reversal: If price pulls back to test this liquidity zone, analysts view it as a reset opportunity within a broader uptrend rather than a structural breakdown — provided those levels hold [2].
- Macro catalysts remain the wildcard: A Fed policy shift or sustained inflationary pressure from elevated oil prices could be the external trigger that forces the short squeeze, making upcoming economic data releases critical watch points [1].
Bitcoin's Bear Trap or Double Top? The $80K Battle That Will Define the Next Move
Bitcoin is sitting at a crossroads that seasoned traders recognize as particularly dangerous — not for bulls, but for the growing crowd of short sellers who have piled into leveraged bets against the world's leading cryptocurrency. With over a billion dollars in short positions clustered just above current price levels, and institutional buyers quietly absorbing supply in the background, the market is coiled tightly. The question is not whether a major move is coming, but which direction will trigger the more violent reaction.
The tension between a technically bearish short-term chart pattern and structurally bullish on-chain fundamentals has created one of the more complex setups Bitcoin has presented in recent months. Understanding both sides of this trade is essential for anyone trying to navigate what comes next.
The Facts
Bitcoin has maintained levels above $76,000 for the past week, recovering meaningfully from its cycle low near $60,500, with price action briefly touching $79,500 before encountering stiff resistance [1]. That rejection has proven consequential: according to CoinGlass data, approximately $1.4 billion in leveraged short positions have accumulated near the $80,000 mark over just the past 48 hours, creating a dense pocket of potential forced buying should price push through that level [1].
The derivatives market tells a striking story of bearish conviction. Bitcoin perpetual futures funding rates have remained predominantly negative for the past two weeks — an unusual situation given that price actually climbed from $72,000 to $78,000 during that same period [1]. This means short sellers are actively paying to maintain their positions even while losing ground, a dynamic that historically precedes sharp short squeezes. On a 30-day basis, funding rates have reached approximately -7%, described as one of the lowest readings ever recorded [2]. The scale of this bearish positioning was further underscored when crypto analyst Darkfost noted that over $1.2 billion in sell volume hit Binance within a single hour, contributing to a sharp intraday decline [2].
On the options side, put contracts are trading at an 11% premium relative to calls on Deribit, signaling that large market participants and market makers remain defensively positioned against downside risk [1]. Meanwhile, the four-hour chart reveals a potential double-top formation near $79,400 following two successive rejections, with weakening buy volumes on the second test pointing to fading short-term momentum [2]. Key downside liquidity targets identified by analysts sit at $74,700 and $73,700, the latter coinciding with a critical higher-timeframe support zone [2].
Contrasting sharply with the derivatives pessimism, spot market fundamentals remain constructive. Strategy added approximately $255 million in Bitcoin between April 20 and April 26, and US-listed Bitcoin ETFs registered $824 million in net inflows during the same window [1]. Long-term holders now control 14.57 million BTC, matching prior accumulation peaks, while distribution over the past 30 days amounted to just 42,100 BTC — one of the lightest sell-side readings of the year [2]. Institutional investors added roughly 92,900 BTC over the past month, and on-chain realized cap flows show only 14,900 BTC in net selling during that period, meaning institutional demand has materially outpaced available supply [2]. MN Capital founder Michaël van de Poppe has maintained upside targets of $85,000–$88,000 for May, viewing the $74,700–$73,700 zone as a healthy reset rather than a trend reversal [2].
Macroeconomic variables add another layer of complexity. With Brent crude prices having reclaimed the $100 level, inflation expectations are rising, yet the Federal Reserve faces competing pressures from a weakening labor market [1]. US government bond futures now reflect 20% odds of a rate cut by September — a complete reversal from a month ago — which has made the 3.95% yield on 5-year Treasuries less attractive relative to risk assets [1].
Analysis & Context
What makes this setup historically significant is the combination of extreme short-side leverage and robust underlying spot demand occurring simultaneously. This configuration has appeared before in Bitcoin's history, most notably in late 2020 and again in early 2023, and in both instances the resolution favored bulls once short positioning reached saturation. The mechanism is straightforward: as institutional and ETF buyers continue removing BTC from liquid circulation, the available float for short sellers to borrow against shrinks, while any upside catalyst forces cascading buy orders from liquidated shorts — a self-reinforcing feedback loop.
The double-top technical pattern is a legitimate concern and should not be dismissed. A move down to the $73,700–$74,700 support band would actually be a constructive development within the broader uptrend, flushing out weak hands and resetting leverage before a more sustainable push higher. The key distinction is between a corrective pullback to support — which leaves the macro structure intact — and a breakdown below those levels, which would raise serious questions about near-term bullish momentum. Given that long-term holders are near a multi-year accumulation peak and institutional flows are absorbing sell-side pressure at an accelerating rate, a structural breakdown appears less likely than a temporary liquidity sweep followed by recovery.
The Federal Reserve dimension deserves particular attention. Bitcoin has increasingly traded as a macro asset, sensitive to real interest rate expectations. If the Fed signals any dovish pivot — or if inflation data surprises to the upside due to elevated energy prices — the calculus for holding fixed-income instruments becomes less favorable almost immediately. That rotation dynamic, combined with $1.4 billion in underwater shorts sitting just above current prices, could produce an explosive move. The conditions for a short squeeze are present; what remains missing is the catalyst.
Sources
AI-Assisted Content
This article was created with AI assistance. All facts are sourced from verified news outlets.