Bitcoin's $60K Reclaim: Relief Rally or Bear Market Turning Point?
Bitcoin climbed back above $60,000 on Wednesday as Fed Chair Kevin Warsh signaled easing inflation pressure, while a rare monthly TD9 technical signal hints that the 2026 bear market may be approaching its final chapter - though leverage data urges caution.
Key Takeaways
- Bitcoin's return to $60,000 was driven by a macro catalyst - softening Fed rhetoric on inflation - rather than by any internal shift in crypto market structure, meaning the macro environment remains the key variable to watch.
- The rare monthly TD9 signal mirrors conditions last seen in mid-2022, but history shows that such a signal marks the beginning of a bottoming process, not an immediate floor - patience is warranted.
- Long-term holder accumulation of roughly 270,000 BTC over two weeks contrasts sharply with record ETF outflows, revealing a split market where institutional flows and conviction holders are moving in opposite directions.
- Leveraged positioning is heavily concentrated between $57,000 and $60,500, making the $61,000 to $62,000 zone a critical threshold - a sustained break there could meaningfully accelerate upward momentum.
- Bitcoin treasury equities like Strategy and Strive are amplifying Bitcoin's price swings dramatically, and their corporate treasury disclosures signal that institutional Bitcoin accumulation continues even amid the bear market.
Bitcoin's $60K Reclaim: Relief Rally or Bear Market Turning Point?
For a market that has spent most of 2026 grinding through losses, Wednesday offered something rare: a reason to exhale. Bitcoin crossed back above $60,000, dragging Bitcoin-adjacent equities sharply higher and firing off a technical indicator that last appeared at the tail end of the 2022 bear market. Whether this represents a genuine inflection or just a temporary bounce inside a continuing downtrend is the question every serious Bitcoin watcher is now wrestling with. The weight of evidence is mixed - but the signals are worth parsing carefully.
The Facts
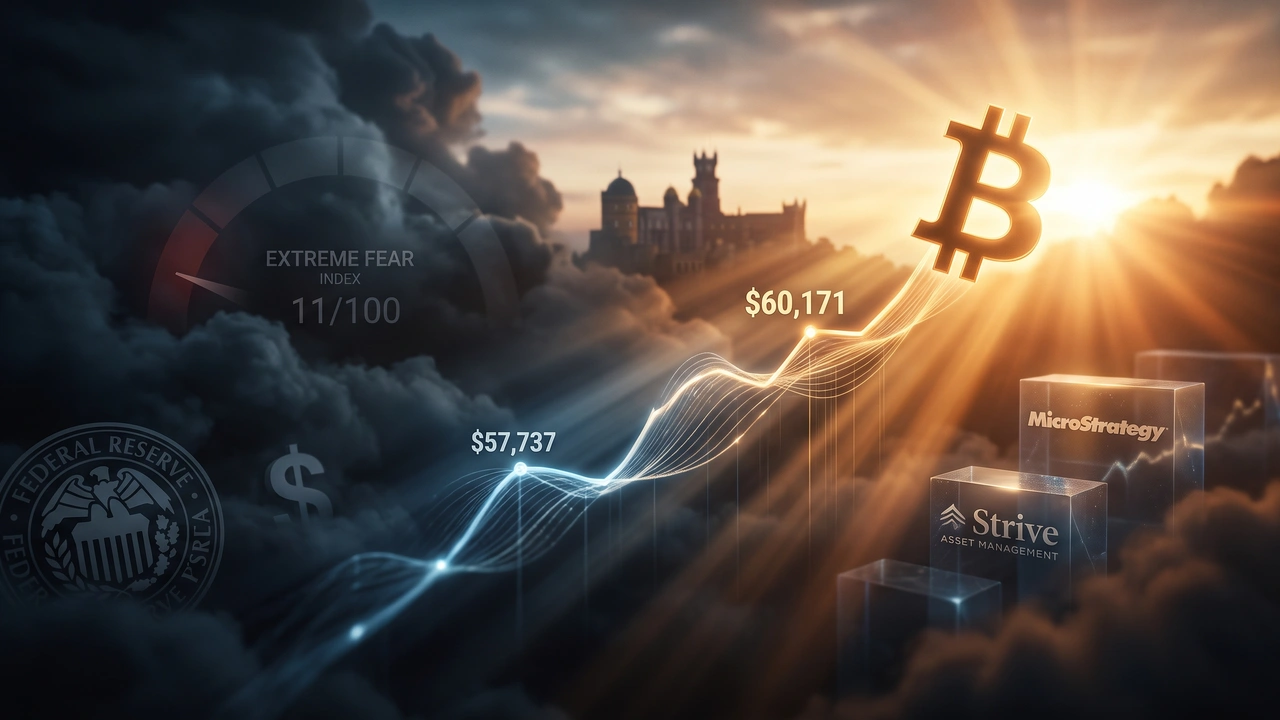
Bitcoin traded near $60,171 on Wednesday afternoon, posting a roughly 2.7% advance on the day after earlier dipping to $57,737 - its lowest point in 21 months [1][2]. The intraday range stretched from that cycle low to a peak of approximately $60,474, on trading volume that came in around $26.68 billion for the session [1]. Despite the day's gains, the coin remains approximately 30% below where it opened 2026 and sits more than $66,000 beneath its all-time high of $126,277, leaving its market capitalization near $1.2 trillion [1].
The catalyst for Wednesday's move came from Fed Chair Kevin Warsh, who addressed a European Central Bank gathering in Sintra, Portugal [1]. Warsh noted that inflation expectations - visible in both survey data and bond markets - had retreated, though he paired that observation with a firm warning that price growth remains above the Fed's 2% ceiling [1]. "We're going to deliver price stability," Warsh said [1]. Markets chose to weight the softer tone over the hawkish qualifier. The U.S. dollar pulled back from a weekly high while equities advanced, and a weaker dollar historically supports demand for Bitcoin and other risk-sensitive assets [1].
Bitcoin treasury companies amplified the day's move in dramatic fashion. Strategy, the Michael Saylor-led firm that transformed itself from a software company into a major BTC accumulator, rose roughly 7.5% on the session after hitting intraday highs of around 13% [1]. Strive Asset Management climbed past 10% at points, touching $12.02, and has now more than doubled in value over the past three months as it has assembled a BTC treasury exceeding 16,000 coins [1]. Both companies function as leveraged proxies for Bitcoin price movements, which explains why their swings consistently outpace the underlying asset. Strategy also unveiled a sweeping corporate finance overhaul this week, lifting the dividend on its STRC preferred shares to 12%, authorizing up to $2 billion in buybacks, and establishing a $2.55 billion dollar reserve to backstop preferred dividends and debt obligations - all while reaffirming Bitcoin as its core treasury holding [1].
Beneath the surface, the technical picture is sending conflicting messages. Spot Bitcoin ETFs logged their worst monthly outflow since their January 2024 launch, bleeding approximately $4.5 billion in June alone [2]. The Crypto Fear and Greed Index sat at roughly 11 out of 100 on Wednesday, deep inside territory classified as Extreme Fear [2]. Yet on-chain data tells a different story at the holder level: long-term Bitcoin holders accumulated around 270,000 BTC over the two weeks leading into this bounce, suggesting that larger, more patient investors are treating the drawdown as an entry opportunity rather than an exit signal [2].
Funding rates complicate the picture further. Leveraged bets positioned for Bitcoin price increases have stayed positive for three consecutive days - even while the coin was logging fresh lows [2]. That combination, crowded bullish leverage sitting atop a weakening price, is the kind of structural setup that can amplify volatility in either direction. Liquidation data across three major exchanges shows the heaviest concentration of open positions clustered between roughly $57,000 and $60,500 [2]. A sustained break above approximately $61,000 to $62,000 would push beyond that congested zone and could accelerate upward momentum; a drop below $55,000 to $56,000 carries the same acceleration risk on the downside [2].
On the monthly chart, a separate technical framework is generating attention. Analyst Tony Severino flagged what he describes as a perfected TD9 buy setup - a signal derived from the Tom DeMark Sequential indicator that fires when nine consecutive candles each close lower than the candle four periods prior [3]. "Bitcoin has 'perfected' a TD9 buy setup on the monthly," Severino noted alongside chart data [3]. This is the first such monthly signal since July 2022 [3]. Separately, analyst Scott Melker pointed to bullish RSI divergences accumulating across multiple time frames, calling it the most concentrated clustering of such signals he could recall [3].
Analysis & Context
The July 2022 TD9 comparison is instructive precisely because it should temper excitement rather than stoke it. When that signal last fired, Bitcoin did not bottom immediately - it required roughly another five months of price discovery before the market finally found its floor. The pattern, if it rhymes, suggests that the TD9 arrival marks an entry into the bear market's concluding phase rather than its last day. That is a meaningful distinction for anyone interpreting Wednesday's bounce as the all-clear.
What makes the current setup genuinely interesting is the convergence of signals across different analytical frameworks. TD9 firing on the monthly, RSI divergences stacking across four-hour, daily, and weekly charts, and long-term holder accumulation running simultaneously - these are the fingerprints of a market where the weakest hands have already sold and where incremental new sellers become harder to find. The persistent ETF outflows and extreme fear readings, paradoxically, reinforce this reading: bottoms are almost never forged while sentiment is optimistic. The discomfort visible in the data is a prerequisite, not a warning sign.
The macro trigger - Warsh's moderated inflation tone - adds a layer that pure technical analysis cannot supply. Bitcoin has been trading in tight correlation with risk assets throughout 2026, meaning Fed signaling carries unusual weight for what was once considered an independent store of value. If the rate cycle is genuinely pivoting toward relief, that removes one of the structural headwinds that has pressured the asset all year. The dollar's pullback on Wednesday is the clearest early indicator of that dynamic playing out.
Sources
AI-Assisted Content
This article was created with AI assistance. All facts are sourced from verified news outlets.