Bitcoin's $71K Ceiling: A Wall of Sell Orders Threatens the Rebound
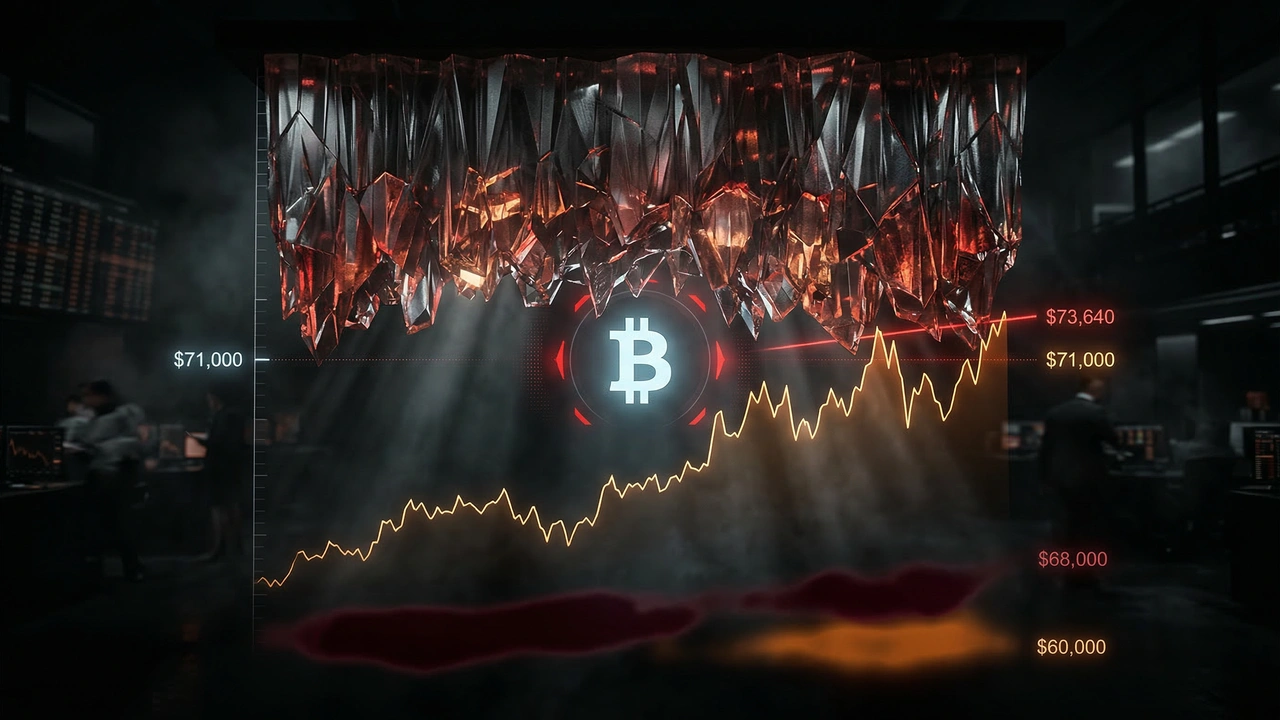
Bitcoin has clawed back above $70,000, but record-high ask liquidity and a critical 50-day moving average overhead suggest bulls face a steep climb before any sustainable recovery can take hold.
Key Takeaways
- The order book is skewed bearish in the near term: With $1.57B in ask liquidity versus $1.125B in bids within a 5% price band, buyers are facing a 40% supply surplus overhead — a setup that has preceded pullbacks in comparable historical configurations [1].
- $71,300–$73,640 is the immediate resistance gauntlet: Bulls must clear the Q1 2024 Timescape level near $71,300 and then the 50-day SMA at $73,640 to shift short-term momentum decisively in their favor [2].
- $68,000 remains a live downside target: The largest liquidation cluster in the current market sits at $68,000, and a liquidity sweep to that level cannot be ruled out before any sustained upside move [2].
- The $86,000–$89,000 zone is the real recovery threshold: Until Bitcoin reclaims this range — where the majority of short-term holders reach breakeven — overhead supply pressure will continue to cap rallies and test conviction [1].
- Realized losses are shrinking, which is genuinely positive: The decline from $2B weekly net losses in February to $264M signals that forced selling has largely exhausted itself, creating a more stable base for a potential recovery — but patience will be required [1].
Bitcoin Stalls at $71K: Record Sell-Side Liquidity and Key Trend Lines Define the Battlefield
Bitcoin has managed to reclaim $70,000 as a foothold, and bulls briefly celebrated a push toward $71,500 — but the celebration may be premature. A convergence of elevated sell-side liquidity, a looming 50-day moving average, and a massive underwater cost-basis cluster stretching up to $99,000 paints a picture of a market that still has serious structural work to do before a genuine recovery can be declared. The rally feels promising on the surface, but the data beneath it tells a more cautious story.
For seasoned Bitcoin watchers, the current setup carries echoes of previous range-bound consolidations that ended with sharp flushes lower rather than explosive breakouts. Whether history repeats or this time proves different hinges on a handful of critical price levels — and the behavior of traders sitting on significant unrealized losses above.
The Facts
Bitcoin's most immediate challenge is a substantial wall of sell orders stacked directly above the spot price. According to crypto trader Ardi, ask orders on Bitcoin recently hit a two-month high, with approximately $1.57 billion in sell-side liquidity positioned above the market compared to just $1.125 billion in bids below [1]. That asymmetry — roughly 40% more supply than demand within a 5% band around spot — creates a meaningful headwind for any upward price movement. Ardi noted that the last comparable configuration emerged in January, right after Bitcoin briefly broke above $98,000, before the price retreated sharply [1].
On the shorter-term price action front, BTC/USD posted gains of approximately 4.5% on the day during Tuesday's Wall Street session, briefly piercing $71,500 for the first time since the weekly open [2]. The move tracked a broader risk-on sentiment, with both the S&P 500 and Nasdaq Composite gaining around 0.5% amid easing geopolitical anxiety [2]. However, traders were quick to identify the resistance levels waiting above. Independent analyst Filbfilb highlighted the 50-day simple moving average sitting at $73,640 as a critical line in the sand, suggesting that bears are likely to defend that level aggressively [2]. Proprietary tools from trading resource Material Indicators reinforced this caution, with multiple signals pointing to a local top forming around the $71,300 zone [2].
Adding another dimension to the downside risk, crypto analyst CryptoReviewing flagged $68,000 as the single largest liquidation cluster in the current market structure, making a liquidity sweep to that level a distinct possibility before any sustained move higher [2]. Meanwhile, trader Jelle offered a binary framing: a confirmed reclaim of current resistance strengthens the bull case in the near term, but a rejection could lock in a bearish retest structure with $60,000 as the next logical target [2].
From a cost-basis perspective, the road ahead looks even more challenging. Short-term holder (STH) realized price — the average acquisition cost for coins held less than six months — sits near $88,900, with the largest supply cluster concentrated between $86,000 and $99,000, representing coins accumulated between November 2025 and February 2026 [1]. Bitcoin researcher Axel Adler Jr. identified this range as the market's primary inflection zone, where a significant portion of the short-term market reaches breakeven [1]. On a more constructive note, realized loss data has begun to moderate: analyst Darkfost reported approximately $611 million in realized losses against $346 million in profit during the most recent week, for a net loss of roughly $264 million — a dramatic improvement over the $2 billion weekly loss recorded during February's drop below $60,000 [1].
Analysis & Context
What Bitcoin is currently navigating is a textbook post-capitulation stabilization phase — and the data confirms it is exactly that: stabilization, not recovery. The reduction in net realized losses is genuinely constructive; it signals that panic selling has largely subsided and that the remaining holders are demonstrating conviction. But conviction among holders does not automatically translate into buying pressure sufficient to absorb $1.57 billion in asks overhead. The order book asymmetry is the most immediate tactical concern, and it mirrors a well-documented pattern in Bitcoin's history: during range rebounds following sharp corrections, profit-takers and breakeven sellers tend to use price strength as an exit opportunity rather than a signal to add exposure.
The $86,000–$99,000 cost-basis cluster is arguably the most important structural factor shaping the medium-term outlook. In previous cycles, large concentrations of underwater short-term holders have consistently acted as a ceiling on rallies — not because of panic, but because of rational human behavior. Holders who survived a painful drawdown from $98,000 to $60,000 and then watched a partial recovery to $71,000 are psychologically primed to reduce risk as they approach breakeven. Until Bitcoin can convincingly clear the $86,000–$89,000 zone — where the bulk of STH positions return to profitability — every rally is likely to encounter progressively heavier supply. This is not a reason for despair; Bitcoin has chewed through similar overhead supply zones before. But it does set realistic expectations for the timeline and the turbulence involved.
The geopolitical backdrop, while improving at the margins, adds an additional layer of macro uncertainty that historically suppresses Bitcoin's risk premium. When Michaël van de Poppe points to Nasdaq strength as a positive catalyst [2], he is highlighting a real correlation — but it is also a correlation that works symmetrically in the other direction. Any renewed escalation in the Middle East or a fresh shock to global oil markets could rapidly unwind the current relief bounce, leaving Bitcoin exposed to the $68,000 liquidation cluster that analysts are already watching closely.
Sources
AI-Assisted Content
This article was created with AI assistance. All facts are sourced from verified news outlets.