Fear, Liquidations, and a Fragile Floor: Bitcoin's Sentiment Crisis
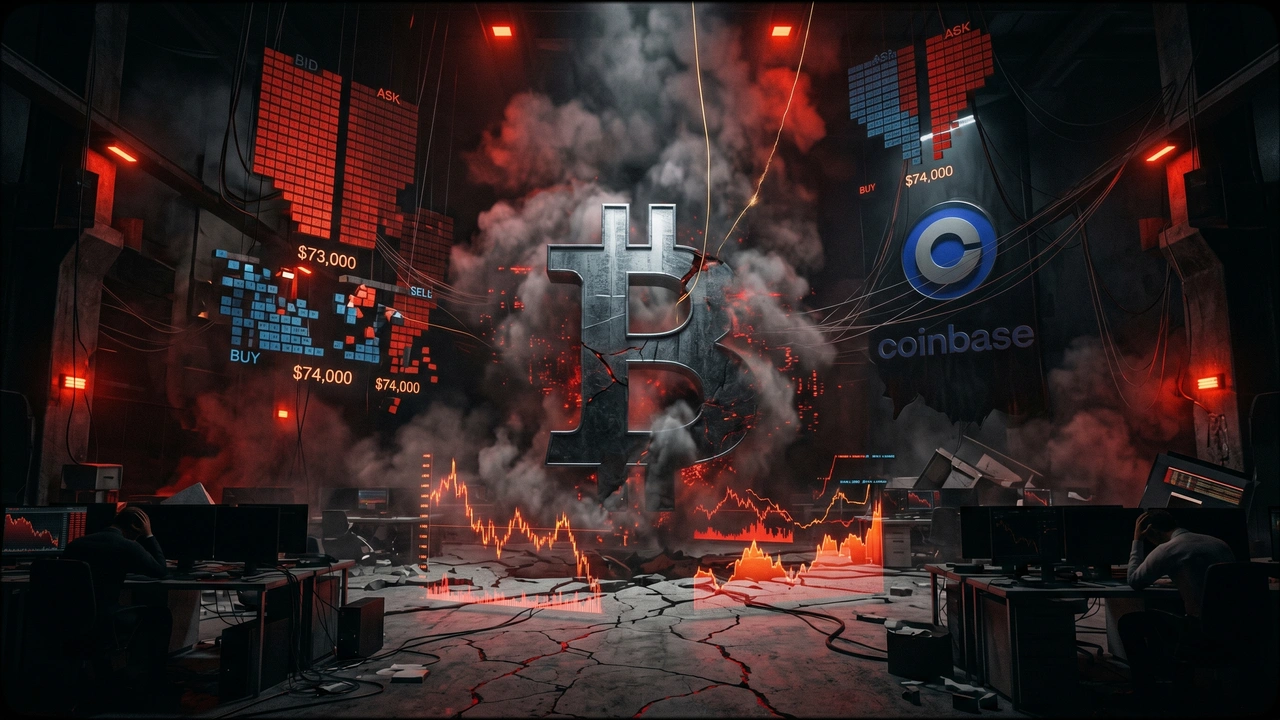
Bitcoin is navigating one of its most psychologically stressed market environments in years, with extreme fear readings colliding with complex on-chain dynamics that reveal a market absorbing heavy selling rather than decisively reversing it.
Key Takeaways
- Sentiment has reached levels comparable to or worse than the bear market troughs of recent cycles, which historically has coincided with market floors rather than continued free-falls - but timing remains the critical unknown.
- ETF outflow mechanics are creating a chain reaction: redemptions feed BTC deposits onto Coinbase, which in turn trigger leveraged long liquidations in futures markets, compounding sell pressure beyond what spot sentiment alone would generate.
- Despite the negative backdrop, the order book structure has turned modestly bid-dominant and roughly $300 million in leveraged longs is concentrated near $73,000-$74,000, suggesting active accumulation - though not yet at a scale sufficient to break the downtrend.
- The retail-versus-institutional framing is a false dichotomy: even ETF vehicles ultimately represent individual retail decisions aggregated through fund structures, meaning retail psychology retains meaningful price influence.
- A durable reversal likely requires external narrative catalysts - geopolitical developments, renewed ETF inflows, or policy signals around the Strategic Bitcoin Reserve - rather than technical factors alone.
Fear, Liquidations, and a Fragile Floor: Bitcoin's Sentiment Crisis
The most dangerous moments in Bitcoin markets are rarely the ones that look dangerous on price charts alone. What makes the current environment particularly worth examining is the confluence of two forces pulling in opposite directions: a sentiment backdrop so bleak it has seasoned analysts reaching for historical comparisons, and a technical structure showing that certain traders are quietly stepping in to catch falling knives. Understanding which force wins - and why - requires looking beyond the headline fear numbers.
This is not simply a story about how bad things feel. It is a story about what happens to Bitcoin's price mechanics when capitulation sentiment meets leveraged positioning, ETF outflows, and an order book that is, for now, holding a line.
The Facts
The Crypto Fear and Greed Index - a widely tracked proxy for overall market sentiment - dropped to a score of 23 on Saturday, firmly inside the "Extreme Fear" territory [1]. The reading was severe enough that Michael van de Poppe, the founder of MN Trading Capital, declared it the worst sentiment environment he had personally witnessed across his career. His framing was stark: he placed the current psychological climate below the collapses of both 2022 and 2018 in terms of collective belief in the asset class [1].
Yet there is a well-documented contrarian argument for reading that despair as a signal rather than a verdict. Analytics firm Santiment has noted that the market has historically moved against the prevailing crowd expectation - and that extreme optimism, not extreme fear, has more reliably preceded near-term price drops [1]. The same logic cut the other way earlier this year: when Bitcoin revisited the $60,000 level in February - what became its yearly low - Gemini co-founder Tyler Winklevoss posted publicly that the prevailing gloom was precisely what made him optimistic [1]. Whether that contrarian script replays again depends heavily on the structural forces at work beneath the sentiment readings.
On-chain data tells a more complicated story than pure fear would suggest. Spot cumulative volume delta (CVD) data - which measures the net aggression of buyers versus sellers in spot markets - indicates that dip buyers have not yet established dominance, even as some accumulation is visibly occurring [2]. Compounding the selling pressure is a pattern linking ETF outflows to exchange activity: redemptions appear to sync with next-day BTC deposits into Coinbase, which in turn create periodic cascades of long liquidations in the futures market [2].
Still, not everything points downward. Open interest heatmap data compiled by Hyblock shows roughly $300 million in concentrated leveraged long positions clustered in the $73,000 to $74,000 band, suggesting a cohort of traders has made an active directional bet at those levels [2]. Separately, Hyblock's bid-ask ratio metric - measured at 10% aggregate order book depth - has turned modestly positive, meaning buy-side orders are slightly outweighing sell-side pressure in the visible book [2]. The indicator runs from -1 to +1, and a reading above zero reflects a structural lean toward bids. The takeaway is not that the bear trend has ended, but that the selling is being absorbed rather than left to fall through empty air.
The debate over who actually drives Bitcoin's price - retail or institutional investors - remains live. Swan Bitcoin CEO Cory Klippsten pushes back on the argument that growing institutional participation has made retail sentiment irrelevant. As he put it: "It still does. You have to remember it's not like BlackRock owns the Bitcoin and Fidelity owns the Bitcoin. It's a bunch of retail accounts, mostly that actually buy that" [1]. His point is structural: even ETF flows ultimately represent disaggregated individual decisions, not monolithic institutional control.
For a genuine trend reversal to take hold, analysts argue that narrative catalysts will need to accompany any technical bid. Among the factors cited: progress on a US-Iran peace framework, a return to positive spot BTC ETF inflows, softer crude oil prices, and potentially a White House signal regarding further additions to the Strategic Bitcoin Reserve [2]. Without one or more of those triggers, the current defensive buying may simply delay rather than defeat the prevailing downside pressure.
Analysis and Context
What the data collectively describes is a market in the "absorption" phase - a condition that has appeared before inflection points in past cycles but that offers no guarantee of timing. The pattern is recognizable: heavy structural selling from ETF redemptions meets contrarian spot accumulation, leveraged longs pile in at perceived support, and the order book leans bid-heavy while the price still drifts lower. This is not capitulation in the traditional sense, where sellers exhaust themselves in a violent flush. It is a slow grind where buyers are present but not yet powerful enough to force a reversal.
The sentiment dimension deserves its own framing. A Fear and Greed score of 23 is not simply a curiosity - historically, readings this low have tended to cluster near local bottoms rather than midpoints of sustained downtrends. The caveat, as Santiment's data implies, is directional: extreme fear is more reliably a buy signal in hindsight than in real time, because the exact moment of maximum despair is rarely identifiable until after the fact [1]. The institutional retail debate adds another layer: if ETF outflows are the primary mechanical driver of selling, then retail sentiment may be a lagging indicator rather than a leading one, reflecting price weakness rather than causing it.
The $73,000 to $74,000 cluster of open interest is the number most worth watching in the near term. That concentration of roughly $300 million in leveraged longs represents both a potential support zone and a liquidation magnet - if price pushes through it, the unwind could accelerate the move downward rather than cushion it [2]. The current environment rewards precision over conviction.
Sources
AI-Assisted Content
This article was created with AI assistance. All facts are sourced from verified news outlets.