RSI Divergence Echoes 2022 Bear Bottom as Bitcoin Holds $60K
A bullish RSI divergence forming across multiple timeframes has analysts drawing direct parallels to Bitcoin's 2022 bear market floor - but not everyone agrees the bottom is in.
Key Takeaways
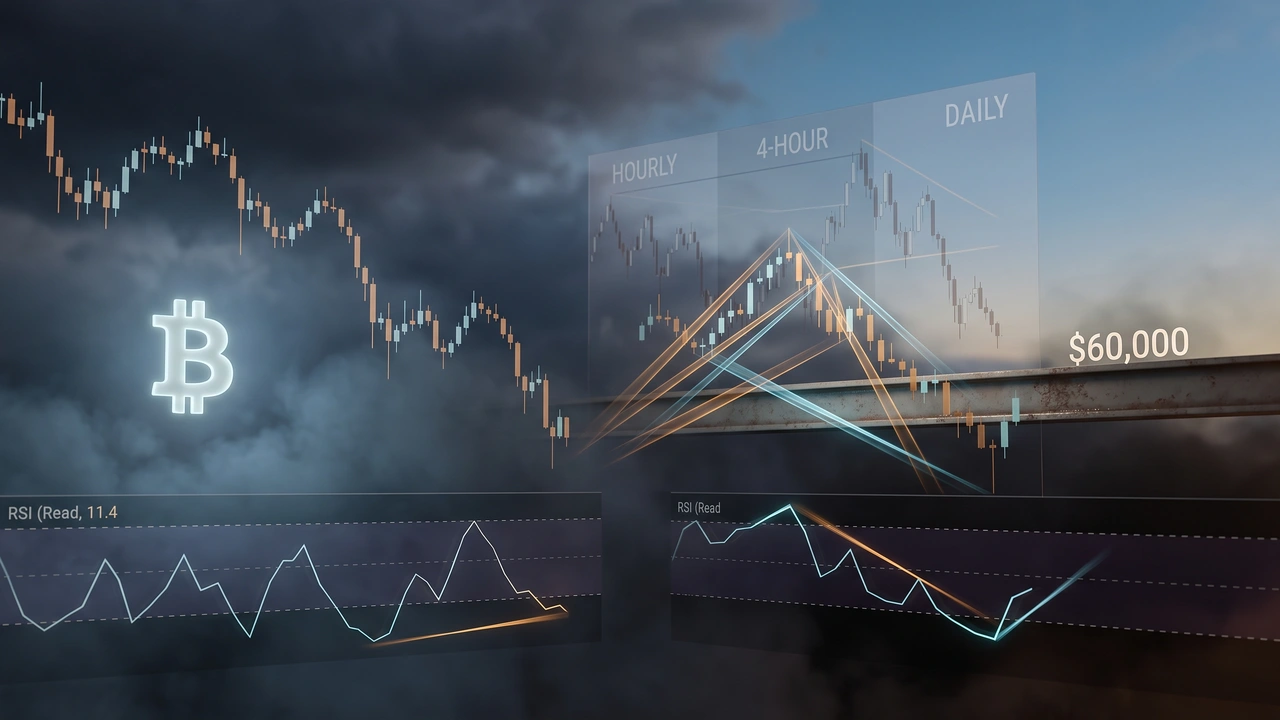
- A bullish RSI divergence has formed across four-hour and daily Bitcoin charts, with the four-hour RSI hitting one of its lowest readings on record near 11.4 at the start of June - a signal that drew direct comparisons to the 2022 bear market bottom.
- The 2022 parallel is historically significant: the last time a weekly RSI bullish divergence appeared at this scale, it marked the cycle low at $15,600 and preceded a durable recovery.
- Not all analysts are convinced the bottom is in - targets of $55,000 remain active, and the 50-month EMA flipping to resistance could extend selling pressure into August.
- Bitcoin is trading more than 50% below its all-time high, a level that long-term focused analysts are beginning to frame as a structural opportunity - while acknowledging that further downside remains possible.
- The $60,000 zone is the critical battleground: whether it holds as support or breaks down will likely determine whether the current divergence signals are vindicated or invalidated in the weeks ahead.
RSI Divergence Echoes 2022 Bear Bottom as Bitcoin Holds $60K
Something notable is happening beneath Bitcoin's surface. While the price itself struggles to hold ground above $60,000 - more than 50% below last cycle's peak - the momentum indicators are quietly telling a different story. A classic bullish divergence pattern has emerged across multiple timeframes, prompting some of the market's sharpest technical minds to reach for their 2022 playbooks. The question is whether history is genuinely rhyming, or whether traders are pattern-matching their way into a false sense of security.
The stakes are real. Just months ago, many observers considered a sub-$100,000 Bitcoin almost unthinkable, with institutional enthusiasm and corporate treasury adoption generating enormous optimism. That reality has since been replaced by deep portfolio losses and a market searching for its footing.
The Facts
Bitcoin spent the past week grinding to reclaim the $60,000 level, with volatility compressing as the price stabilized just above that threshold [1]. The more significant development, however, was playing out on the charts. Across the hourly timeframes, swing lows have been printing progressively higher even as the price itself continued to drift lower - the textbook setup for a bullish RSI divergence [1].
On the four-hour chart, the divergence became particularly pronounced, with the RSI registering higher lows against a backdrop of declining price action [1]. The four-hour RSI had already hit a reading of just 11.4 at the start of June, placing it among the most oversold readings on record for that timeframe [1]. Analyst Lukasz Wydra, who has been tracking the signal across daily charts, told his followers on X that the divergence had been officially confirmed, noting that while it could still deepen, Binance appeared to be actively defending price levels [1]. He called the readings an "encouraging sign" - careful language that stops well short of a buy signal but acknowledges something meaningful may be unfolding [1].
The comparison drawing the most attention comes from pseudonymous trader Rod, who overlaid the current weekly RSI pattern against the equivalent period from the 2022 bear market [1]. The visual parallel is striking: back then, a weekly RSI bullish divergence materialized precisely as BTC/USD carved out its cycle low at $15,600, establishing what became a durable multi-month floor [1]. Rod's assessment was blunt: "It's 2022 again" [1]. The chart comparison suggests the current structure may be replicating that bottoming process, though at a considerably higher price level.
Not everyone is ready to call the low. Niels Klaver, co-founder of crypto platform STABL Agency, maintained his target of $55,000 as a necessary stop before any meaningful directional shift takes hold [1]. Trader Rekt Capital offered a more granular timeline, suggesting that July could bring a temporary relief bounce - historically, the month tends to diverge from June's price behavior - before the 50-month exponential moving average flips from support to resistance and triggers further downside into August [1]. In that scenario, the $60,000 level progressively weakens as a structural floor, setting up additional pressure in the third quarter [1].
The broader sentiment picture matches the technical uncertainty. With Bitcoin sitting more than half below its all-time high, German-language analysis from BTC Echo captured the psychological weight of the moment, noting that the question confronting holders now is whether the final bottom has arrived or whether July holds another setback [2]. The same analysis observed that long-term oriented investors are beginning to view the current price range as a generational opportunity - the cost, of course, being the willingness to absorb continued short-term pain [2].
Analysis & Context
The 2022 parallel deserves more than surface-level attention. When Bitcoin bottomed at $15,600 in late 2022, the weekly RSI divergence was not immediately obvious to most market participants - it only became clean in retrospect. That is precisely why these signals carry weight: they tend to attract serious analysts before they attract retail attention, which is part of what makes the floor durable once it forms. The current divergence is being spotted and discussed publicly while the price is still under pressure, which introduces both credibility and risk. The pattern is visible, which means it can be faded.
The bear case from Rekt Capital also deserves serious consideration. The 50-month EMA flipping from support to resistance is not a minor technical event - it would represent a structural regime change in the medium-term trend. If that scenario plays out through August, the divergence signals forming now would likely be considered a relief setup rather than a true bottom confirmation. Pattern recognition is only useful when paired with an honest assessment of invalidation levels, and $55,000 to $60,000 appears to be that zone.
What connects both camps - the bulls citing RSI divergence and the bears targeting lower prices - is a shared acknowledgment that Bitcoin is in the late stages of a correction rather than the early stages of a new collapse. Whether the floor is here at $60,000 or a few thousand dollars lower, the structural setup increasingly resembles accumulation territory for participants with long enough time horizons.
Sources
AI-Assisted Content
This article was created with AI assistance. All facts are sourced from verified news outlets.